Selected project · Data story
Which salespeople missed their target?
A B2B SaaS sales org beat plan overall, yet three reps quietly missed their number. I rebuilt five raw CRM exports into a tested warehouse and found them by reporting at the grain where targets actually live.
The answer
Found three missed targets hidden inside healthy looking offices, each with a different root cause and a different fix.
The question
Why did some salespeople miss their quarterly target when the company beat plan overall?
The data
Synthetic data that mirrors a real engagement. Five CRM exports: opportunities, activities, accounts, salespeople, and targets. Fifteen months, around 3,300 opportunities and 8,200 activities.
The goal
Point coaching and hiring at the exact people who need it, not at the offices that merely look busy.
A B2B SaaS company closed a strong quarter. New business landed at 202 percent of the combined target. The Head of Sales still had a nagging question: a few people did not hit their number, and he wanted to know who, and why. The honest answer depended entirely on one modeling choice. This is that analysis, from five raw CSV exports to a tested, reproducible warehouse.
The approach
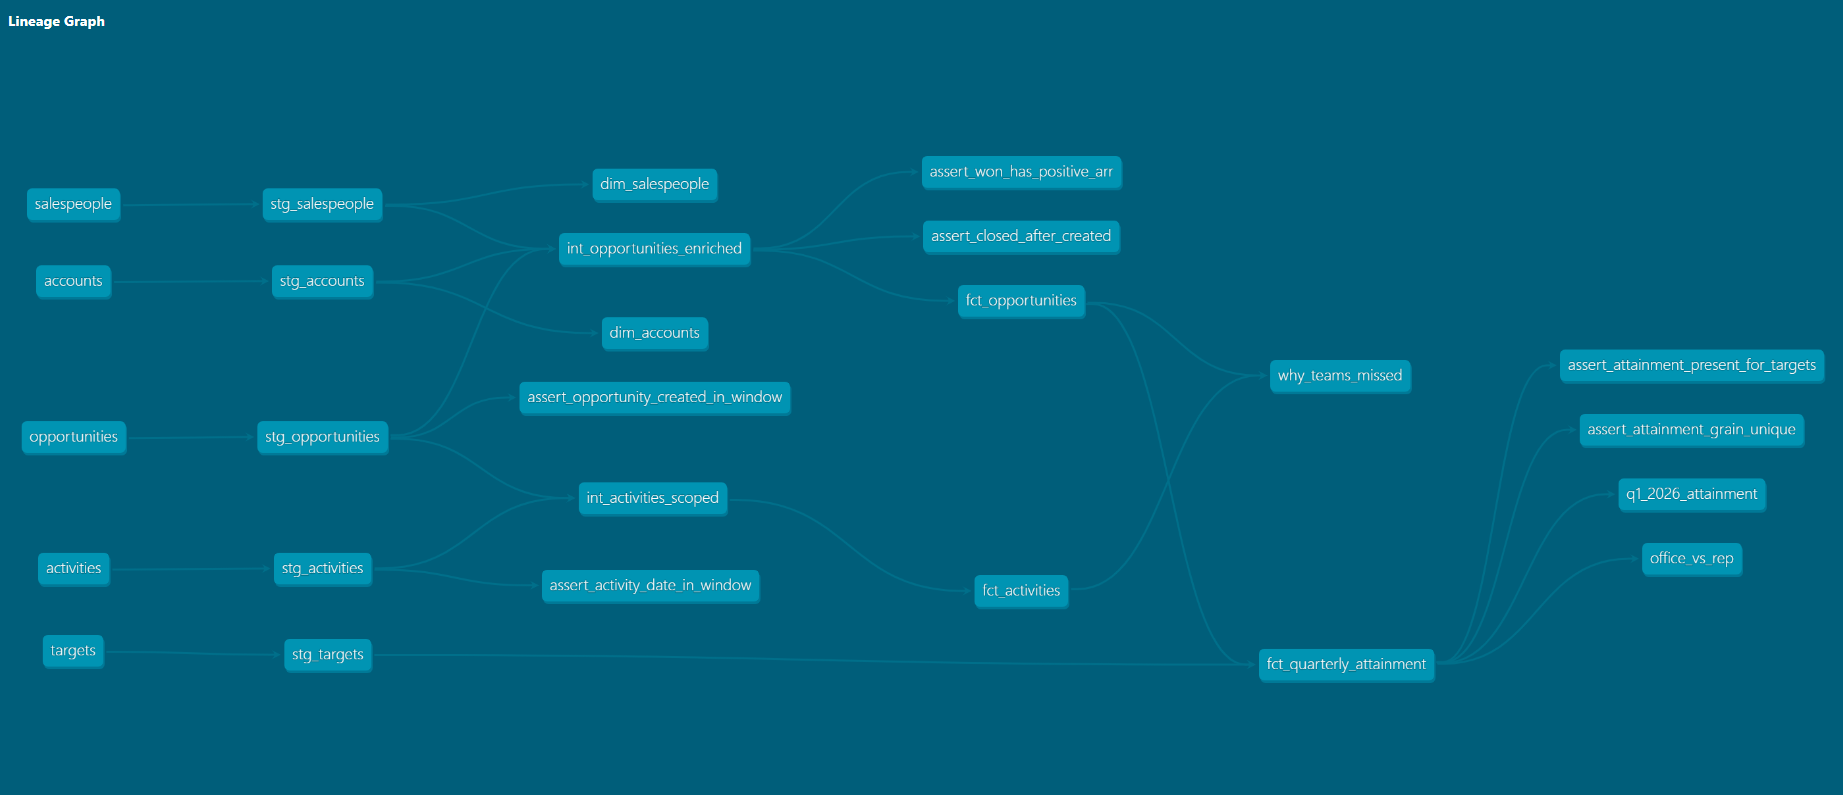
I treated the case as a production pipeline, not a throwaway query. Eight steps. Explore every file and profile it before trusting one number. Model the target shape as a layered, dbt style warehouse and fix the grain. Diagram the lineage so the model stays legible. Verify the joins and the keys. Catalog every data quality issue with a count and a rule. Read the distributions that drive the result. Produce the answer the question needs. Ship it as a pipeline that anyone can rerun.
The tooling stays deliberately light. Python standard library for profiling, with zero dependency risk against raw files. DuckDB to run the transformation SQL end to end and confirm every figure. dbt for the production model, layered staging to intermediate to marts, so each concern lives in one place. The SQL is standard throughout.
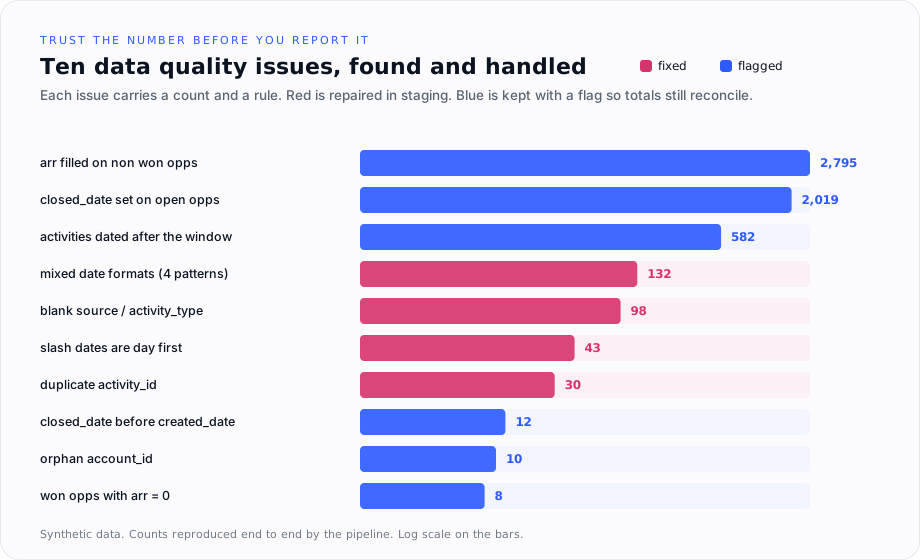
Before any analysis, I trust the inputs. Profiling surfaced ten data quality issues across the exports. Each one carries a count and a handling rule. Some get repaired in staging. Some are kept with a flag, so totals still reconcile and nothing is silently dropped.
The model makes three decisions that shape every number downstream. The grain is salesperson by office, because that is exactly where the targets are set. The metric is new business won, credited in the quarter the deal closes. Credit follows the account office, not the rep home office, so a deal on a German account counts toward Germany even when a US based rep closes it.
What the data showed
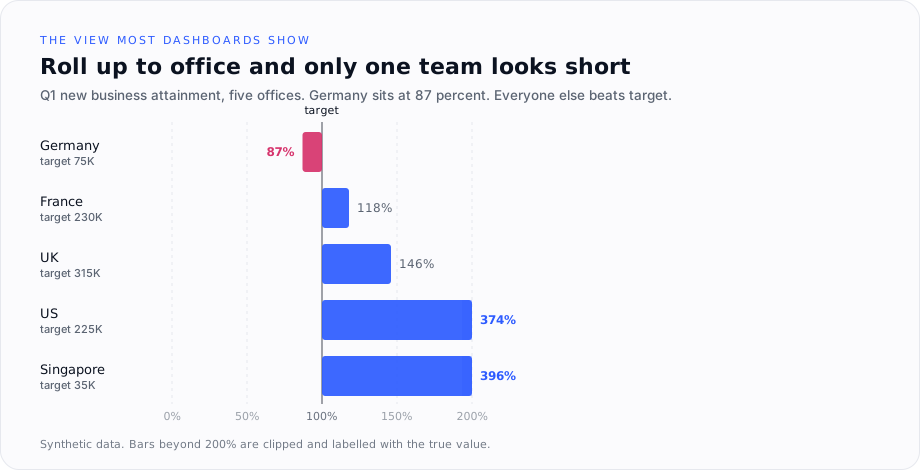
Roll the quarter up to office, the level most dashboards default to, and the team looks fine. Four of five offices beat target. Only one, Germany, reads slightly short at 87 percent. Nothing here says send help.
Drop to the grain where the targets live, salesperson by office, and the real picture appears. Three people missed. Each one is masked inside an office that looks healthy. SP009 booked zero against a 45K target. SP001 reached 64 percent. SP005 reached 74 percent. The other eight rows all cleared their number.
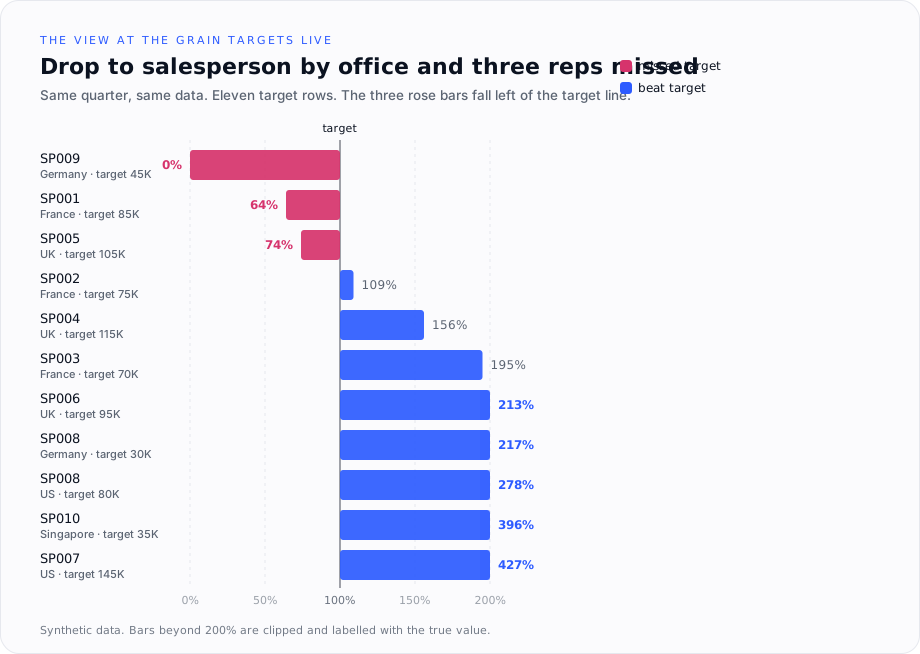
The office rollup and the rep grain disagree, and that disagreement is the finding. The two tables describe the same quarter. One says a single team narrowly missed. The other says three people missed, in three different offices, for three different reasons.
The result
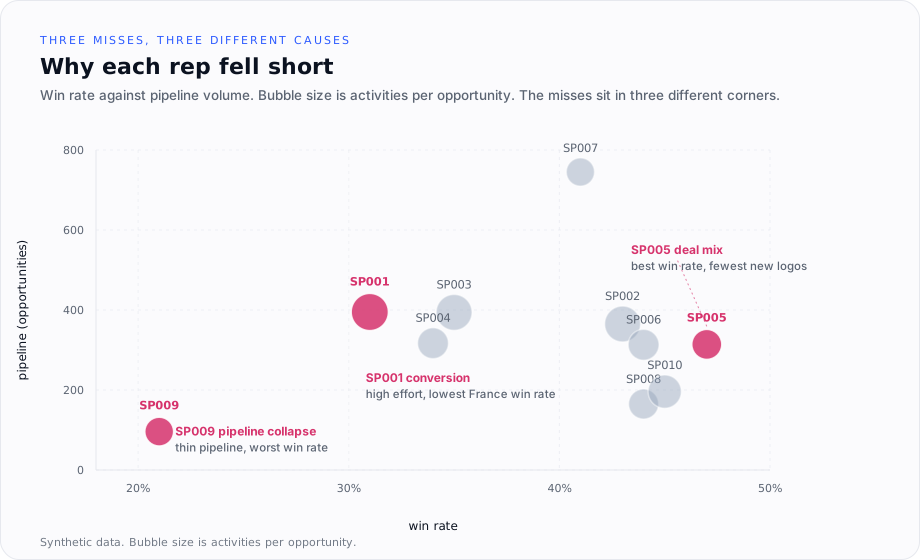
Reporting at the salesperson grain is what makes a useful prescription possible. SP009 in Germany needs pipeline volume and late stage coaching. The office number is false comfort, propped up by one rep covering for another, which is a staffing risk rather than a healthy team. SP001 in France needs conversion support, not more activity, because the effort is already the highest on the team. SP005 in the UK needs larger or more frequent new business deals, since the closing skill is the team’s best asset.
The office view would have sent help to the wrong place. It would have flagged Germany as a team problem and missed France and the UK entirely. The same data, read at the right grain, turns a vague worry into three specific, actionable plans. The last recommendation is to fix the CRM at source, since the date formats, the ARR on open deals, and the duplicate activity logs are the issues that erode trust in any future dashboard.
How it is built
The model runs as a dbt project on DuckDB, so the five CSVs become a tested warehouse with one command. Staging mirrors each source one to one and does cleaning only. Intermediate holds the business logic, joining offices and deriving the measures and quality flags. Marts expose conformed dimensions and facts, plus one purpose built table that answers the question. Forty data tests protect the result: key uniqueness, accepted values, referential integrity, grain uniqueness on the answer table, and singular tests tied to each data quality finding. Integrity breaks the build. Known data noise warns. One command, dbt build, loads the seeds, builds every model, and runs every test.
A note on the data
The data on this page is synthetic. It mirrors the structure, the shape, and the relationships of a real engagement, with no real company, customer, or person present. The method is real and the numbers are illustrative. The point of the piece is the modeling judgment, not the figures.
Assumptions worth confirming
New business is the primary reading of the target. Including upsell would lift SP005 from 74 percent to 97 percent and change whether SP005 even counts as a miss, so that definition is the one to confirm with the business. Targets cover a single quarter, so this is a snapshot, not a trend. Orphan accounts and zero value wins are flagged rather than dropped, so totals reconcile and the problems stay visible for a source fix.
Building or fixing a data platform?
This is the kind of work I do end to end. Talk to me.