Selected project · Data story
Is the new build safe to ship?
A mobile game studio ran two builds side by side and asked whether the new one should roll out to every player. I turned two raw event exports into a reproducible verdict: hold the rollout, one level is broken, and here is the proof.
The answer
Held the rollout. Build 11.0 keeps fewer players every day of the first week, and the whole loss traces to level 7, whose completion collapses from 85 to 40 percent.
The question
Should build 11.0 go to a full rollout, and if not, what exactly broke?
The data
Synthetic data that mirrors a real mobile analytics case. Two event exports: daily activity and level progression. Ninety days of Android installs, ten countries, about 615,000 rows.
The goal
Give the rollout decision an evidence base: ship, hold, or fix, with the exact thing to fix.
A mobile game studio had two builds of its puzzle game live at once. Version 10.2 was the proven build. Version 11.0 was the new one, released to a share of players and moving toward full rollout. Publishing wanted to know whether the new build keeps its players. Design wanted to know whether anything specific broke. This is that analysis, from two raw event exports to a decision backed by a number at every step.
The approach
I treated the two exports the way I treat any unfamiliar warehouse table: profile first, compute later. The two files agree on one grain (install date, build, country, network, package, cohort day), and every structural claim gets asserted before a single KPI runs. The started equals completed plus failed identity holds on all 530,411 progression rows. No duplicates, no negatives, no orphan cells between the files, contiguous install dates, and a complete extract day. The row level data is clean. The real traps are structural: a label that cannot be true, and a denominator that quietly lies.
The first trap is a version label. A third tag, 11.0.1, carries installs dated two months before its parent build exists, and a patch cannot predate its parent. It amounts to 767 day 0 players, 0.3 percent of volume, and it behaves like 11.0. Folding it in would be a guess, dropping it in silence would hide a pipeline defect, so it is quarantined from the headline and flagged as its own finding for data engineering.
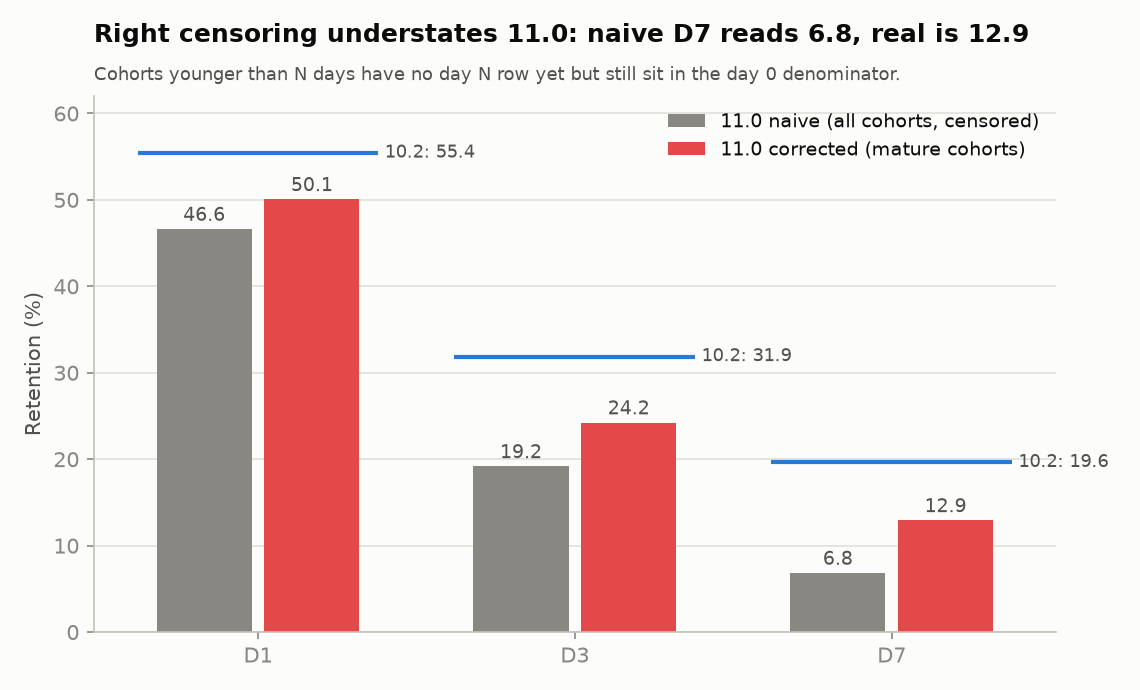
The second trap is right censoring. Pool every cohort and the new build looks catastrophic: day 7 retention reads 6.8 percent. But cohorts installed less than seven days before the extract have no day 7 row yet and still sit in the day 0 denominator. The honest read compares the builds only over the window where both exist and every cohort is old enough to measure, and there day 7 retention is 12.9 percent. The naive read nearly doubles the apparent damage. A per day maturity gate on the full ninety day history lands on the same verdict, so the window is not doing the work.
A last check protects the comparison itself: the rollout split. Day 0 mix across ten countries, seven acquisition networks and the store package differs by at most 0.72 points between the builds. The split is clean, so the pooled worldwide comparison is fair. Checked, not assumed.
What the data showed
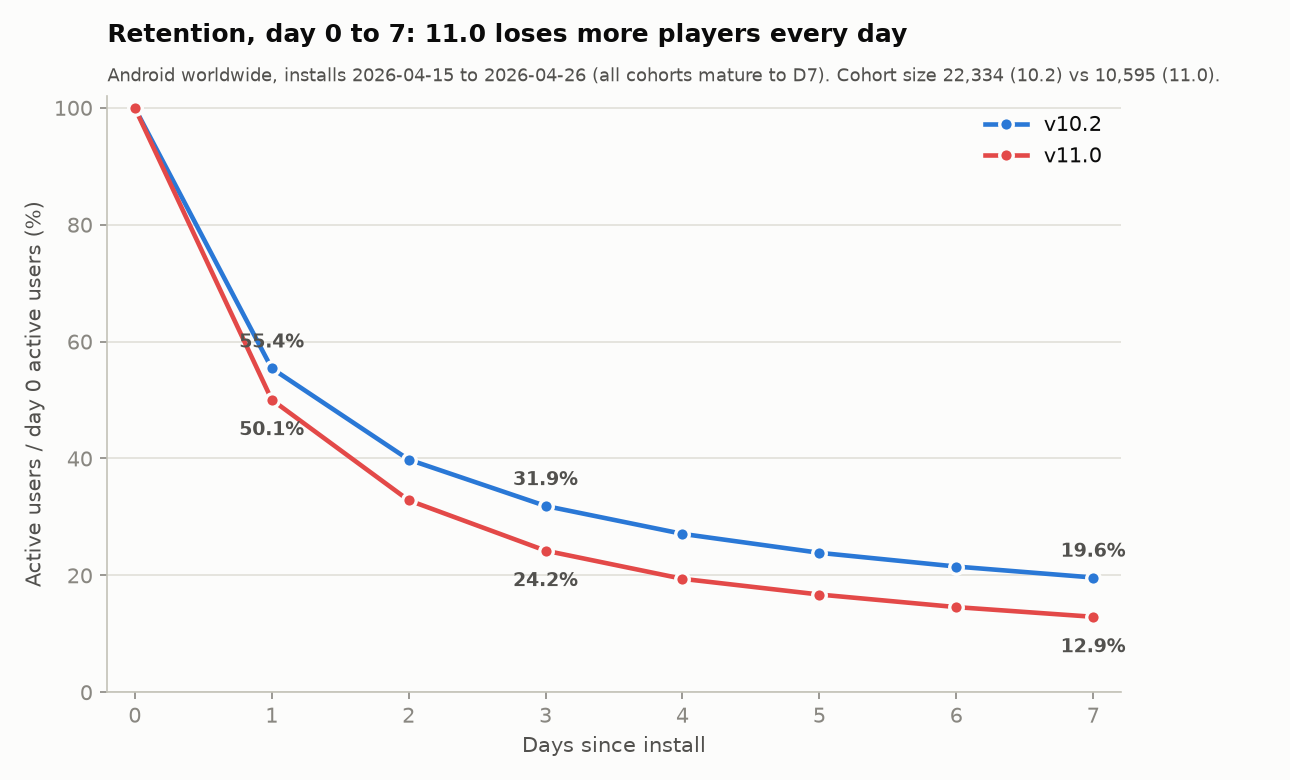
On the matched window, build 11.0 keeps fewer players at every point of the first week, and the gap widens with cohort age: 10 percent fewer on day 1, 24 percent on day 3, 34 percent on day 7. Two proportion z tests between 9.1 and 15.0 rule out sampling noise, and the day 1 gap is negative on all twelve shared install dates. The survivors also play less: 31 minutes per active player per day against 44 on the old build.
A widening retention gap says players quit, not why. The level funnel answers why. Judged on completion per attempt, the two builds track each other closely on levels 1 to 6. Then level 7 falls off a cliff: completion collapses from 85 to 40 percent, attempts per player jump 70 percent from 1.14 to 1.94, and time per attempt stays flat at about 160 seconds. Players replay a level that plays normally and fails, which points to a difficulty or win condition change, not a crash. A crash would truncate attempts, and a zero playtime check confirms nobody crashes out at launch.
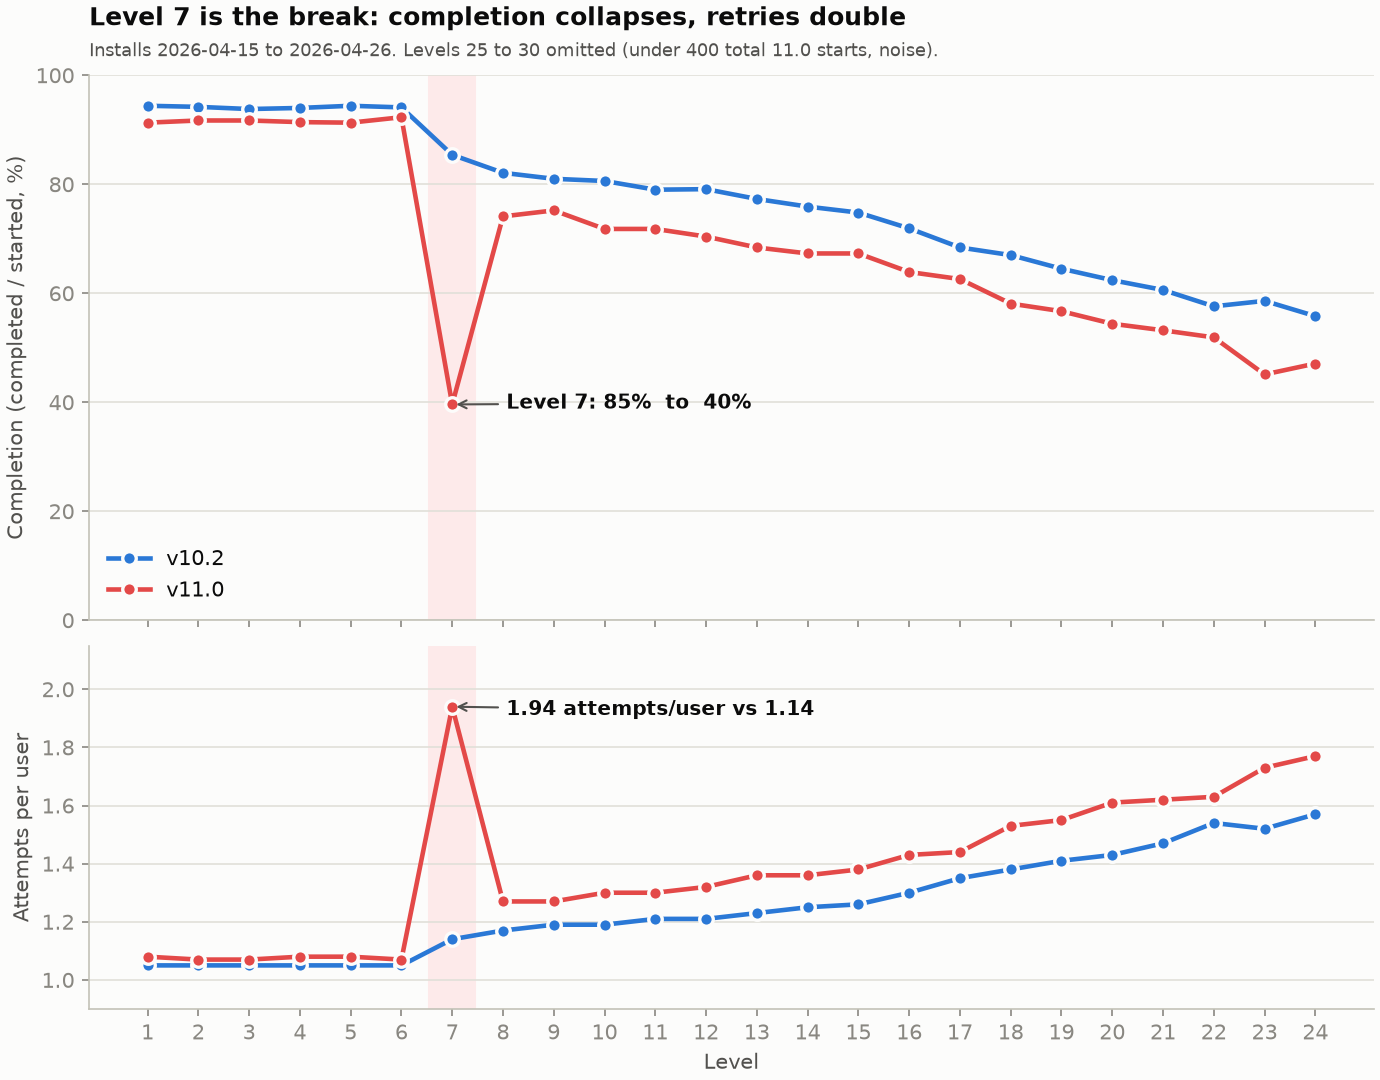
The break sits in the build, not in a market: level 7 completion falls to about 40 percent in all ten countries, from the very first 11.0 cohort, and stays flat. Beyond the cliff there is a milder drift, about 8 points of completion on levels 8 to 24, and levels 25 to 30 carry too few players for any claim, so deltas there are reported as noise rather than findings. A US only rerun of the retention read gives the same shape as worldwide, which closes the regional question.
The result
Hold the rollout. That was the recommendation, and it is a cheap one to act on, because the analysis names the fix: roll back or rebalance level 7, confirm completion returns near 85 percent on a fresh cohort, then resume the ramp once day 1 and day 3 recover. The alternative, shipping as is, costs a third of day 7 retention and 13 minutes of daily play per active player, which is the economics of a free to play title eroding at the exact point where habits form.
The metric choices are what make the finding visible. Retention uses active players at day 0 as its denominator and a matched, mature window, so censoring cannot fake a collapse. Level health uses completion per attempt and attempts per player, both ratios, so heavy retries on a hard level cannot hide the churn behind a big reach number. And the impossible 11.0.1 label goes back to data engineering as a finding of its own, because a mistagged build in the tracking pipeline will poison the next experiment too.
How it is built
One Python script runs the whole pipeline on DuckDB: the integrity checks, the data quality gate, the retention reads, the mix check, the level funnel, the three charts, and a metrics file with every number the analysis produced. The four SQL queries also run standalone from the DuckDB CLI, each commented with the reason for every filter, so the logic can be walked through line by line. The analysis window is derived from the data, never hardcoded, so a nightly rerun stays honest instead of faking a retention collapse as fresh cohorts arrive. No API key and no network are needed: two CSVs in, one command, and every figure on this page rebuilds.
A note on the data
The data on this page is synthetic. It mirrors the structure, the shape, and the traps of a real mobile analytics engagement, with no real game, company, or player present. The method is real and the numbers are illustrative. The point of the piece is the judgment: which reads to trust, which to quarantine, and what to do next.
Assumptions worth confirming
Retention is measured to day 7, so this is a first week verdict, and a day 30 read would need a longer window. The brief covers engagement and progression, so monetization stays out of scope, and a real rollout decision would put revenue per player next to these curves. The level 7 diagnosis is behavioral: the data says difficulty or win condition, and the design team owns the confirmation. Finally, the 11.0.1 mistag deserves a root cause in the tracking pipeline before the next experiment inherits it.
Building or fixing a data platform?
This is the kind of work I do end to end. Talk to me.